
General
– a Spectrum Analyser Shows the “Exact” Amplitude of all Frequencies of a Signal
– the Amplitude of Low Frequency Content in a RTA Spectrum Analyser Shows More Information by Nature than in the High Frequency Content, thus to Match the Perceived Loudness (because Low Frequencies Need More dB to Meet Perceived Loudness in dB of High Frequencies <-> Fletcher/Munson)
– sometimes it would be Good to have the Analyser “Balance” that Out so we can See better what other Frequencies in the overall RTA also Stand Out (i.e. you get a better Grasp of other Frequency Contents or Gaps)
- so “Tilt” will Reshape the Envelope by Setting an Custom “dB” Amount, i.e. Rotate the Graph
- Positive Tilt Values = Increase Displayed Levels of High Frequencies
– +3dB = Pink Noise is Shown Flat
– 0dB = White Noise is Shown Flat
Tilt RTA Example
1) Insert a RTA to a Track or Mix Bus and Adjust “Tilt” as Needed (Start with +3dB Tilt)
– use 3rd to 6th Octave Analyser
2) Observe the Low End of other Songs
3) Look for any Peaks or Dips in the Low End
4) Adjust with EQ or Level Adjustments
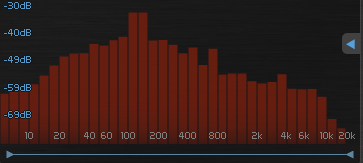
Dualism No Tilt (Default)
– you clearly See the Peaks at around 130Hz

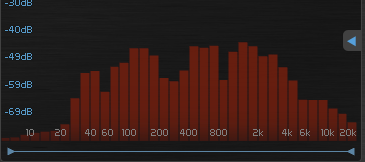
Dualism +3dB Tilt (Equal Low vs High)
– Peaks at around 130 Hz are Now (Visually) Less Present, but Better we See the “Build Ups” Around 600Hz plus 1500Hz and the Dip Around 300Hz

Leave a Reply