
Table of Contents
General
- also Called “DR” or “Peak Over Average Ratio”, or “PLR” = Peak to Loudness Ratio, or “PSR” = Peak to Short Term Loudness Ratio, Micro Dynamics (or Just Dynamics)
- i.e. it Gives you an Insight of the Short Term Dynamics of a Track
– it Looks at the Short Term Punchiness of a Track, Created Using a Ratio of the Short Term LUFS to Peak Level (Not the Same as Crest Factor which Uses RMS to Calculate the Dynamic Range)
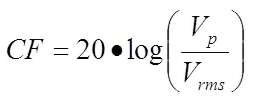
- Basically the Difference in Decibels between the Peak and RMS Levels of a Signal, i.e. the Difference between Average Soft Levels and Average Loud Levels in a Program
- e.g. a Section of a Song has a Peak Level of -7.2dbFS and an RMS Level of -18dB, you End up with a Crest Factor of 10.8
- the Lower the Dynamic Range Readout the More Flat is a Track (i.e. Little Dynamic Range and Overcompressed)
Crest Factor
- Uses Ratio of Peak Level to RMS Level in a Waveform measured in dB
- i.e. Crest Factor which Uses RMS to Calculate the Dynamic Range (which is Different from Newer Dynamic Range Readings that Use Short Term LUFS vs Peak Level)
- Crest Factor tells us How “Close” a Piece is together in Terms of Frequency Spectrum, Transients etc., but Consider that a Drum has a Strong Impact on Crest Factors respective Songs without Drums react differently to Overall Crest Factor of course
Large Crest Factors = will generally be of a Very Dynamic Material
Smaller Crest Values = seem to belong to Moderate Compressed Material
Almost No Crest Factor = will typically be Heavily Compressed & Brick-walled Material
Leave a Reply