
General
– Fletcher invented the Reference 1kHz Test-Tone Calibration Method, so All Frequencies are Linear at 1000Hz
– Most Engineers Passing References to the Fletcher Munson Curve
– it is a Graph that Reflects How the Frequency Response of Human Hearing is Different at Different Overall Loudness Levels
– Human Hearing is Never Flat, there is always a Peak around 3KHz or so (a Natural Resonance) and then Our Sensitivity Gradually Falls Off at the Lowest and Highest Frequencies
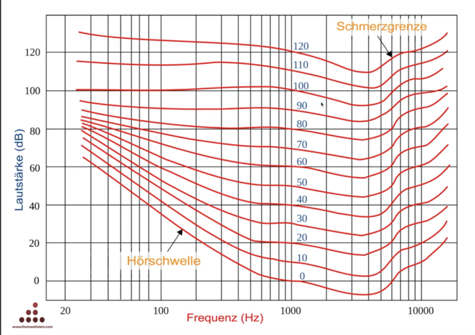
– we know that the SPL for 1Khz is 40dB, so if you follow along for Example the 40db from 1000Hz to 50Hz, you meet at ca. 65dB
– this means in order for us to perceive the Test-Tone to be at the same Amplitude as the Tone at 1Khz, it needs to be Played Back at 65dB (rather than 40dB)
– i.e. 50Hz Needs 15dB More in Order for us to Perceive it to be Heard Equal Loud
– in Conclusion we are less sensitive for Lower Higher Frequencies and more Sensitive for Sounds from 1000Hz to 5000Hz, therefore any Change in that Area is more hearable by Humans
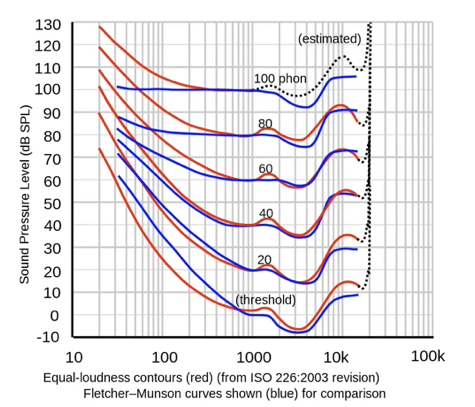
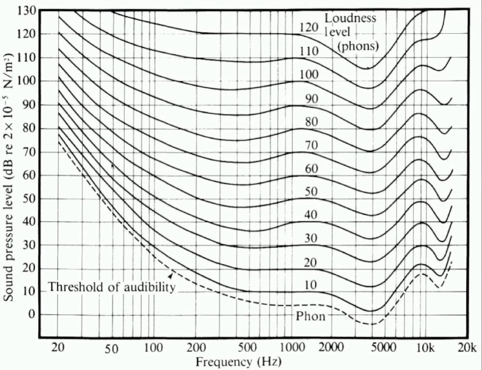
Human Hearing Response Curve Graphics
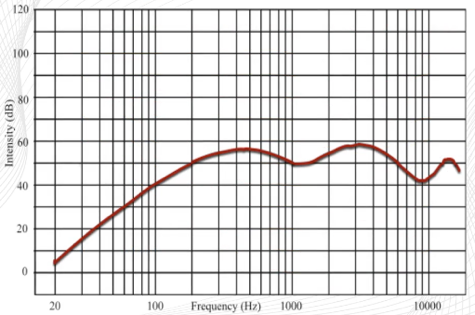
– the Amount of the Gradually Fall Off Depends on the Overall Listening Level
– the Fletcher Munson Graph is a Set of Curves that Illustrates these Level Based Response Differences in a Kind a “Backward Way”, by Showing Reverse of Upside Down Curves
– i.e. the Graph Does Not Show the Actual Curve Human Hearing Response, but What EQ it would Take at Different Listening Levels to Theoretically Flatten Out the Human Hearing Response
– as a Side-Note, the “Loudness” Feature on an Consumer Amplifier Does Exactly that, i.e. Compensate for “Lost Energy” at Low Listening Levels Based on the Fletcher Munson Graph
Fletcher Munson Curve
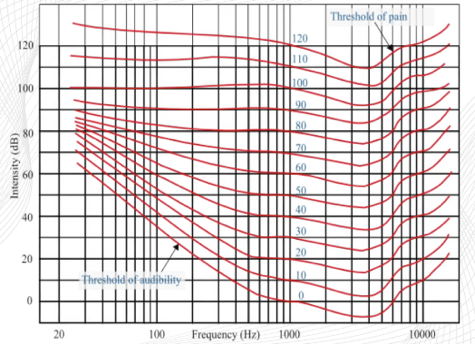
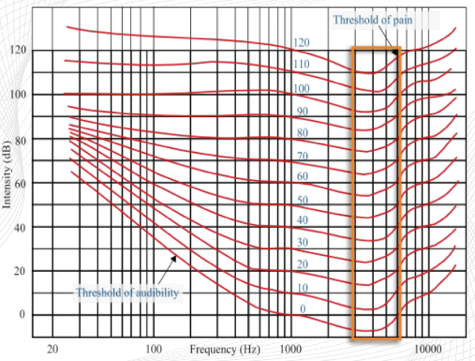
– you can See that Around 3KHz to 4KHz the Curve (here a Bump) is pretty Consistent
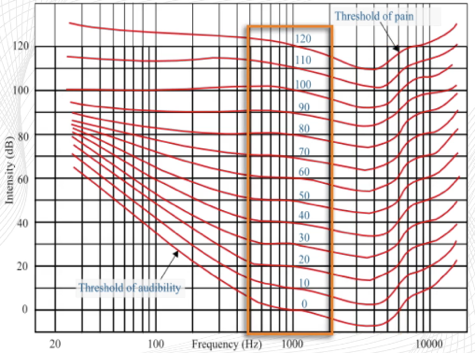
– also at 1KHz the Curve (here rather Flat) is pretty Consistent
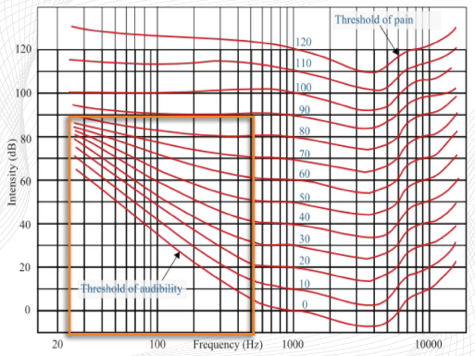
– then at Lower Listening Levels it Shows How Much More Bass Boost would be Required
– or Theoretical Flat Response that would be Required at Higher Listening Levels
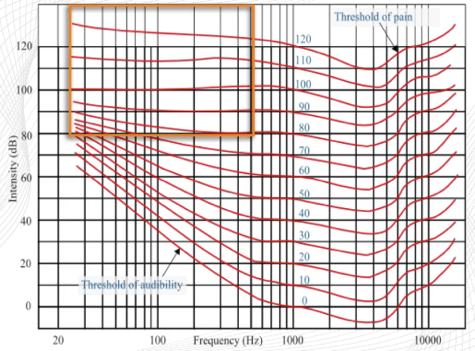
– if you Look at the Top of the Graph at Extremely Loud Listening Levels (Above 90dB / 100dB SPL or Over), the Treble and Bass would Sound a Bit Louder than at other Listening Levels and (the Graph Illustrates that Less Compensation Required for Bass and Treble at those Levels)
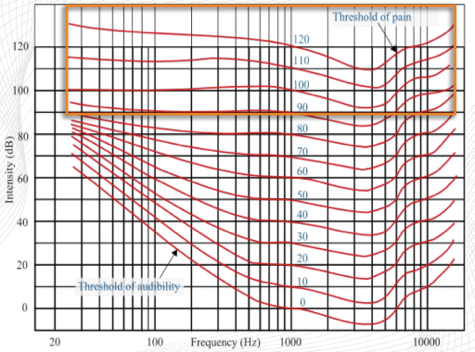
– if you Compare to 80dB to 90dB SPL Listening Levels (which is Loud but Not Extremely Loud), the Hearing while Still Not Flat, is at Flat as it Gets
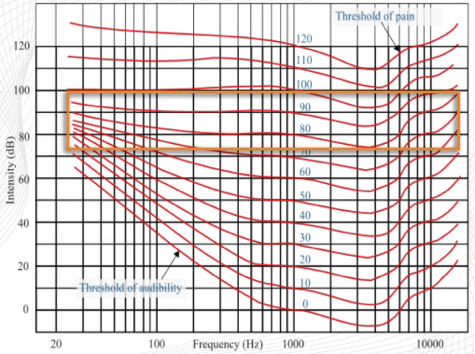
– when we Lower the Listening Level even more (Below 80dB), we Rapidly Lose Sensibility
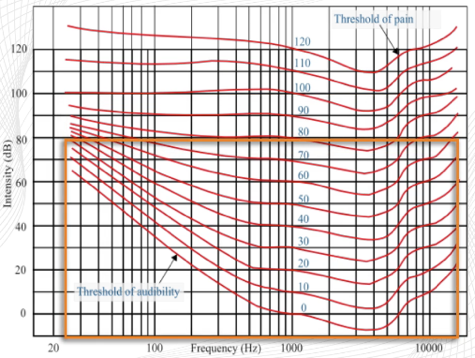
– Sensibility to the Treble
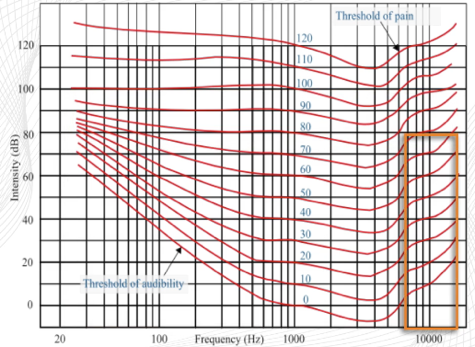
– and even More Dramatically the Sensibility to the Bass (again, the Graph Shows Boosts Needed to Restore the Bass at Low Listening Levels)
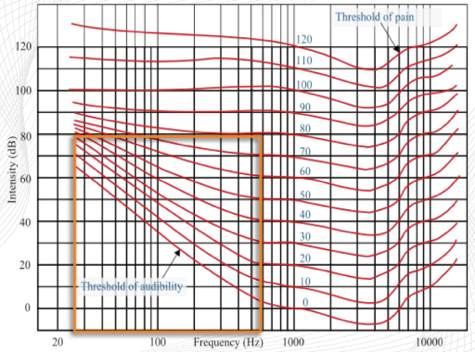
– when we Take these Facts into the Studio, with a Listening at +/- 70dB SPL we Perceive a Tonal Balance that is “Bass Shy” and a Little “Treble Shy”
– when we Listening at +/- 10dB SPL, then we Perceive More Bass and Treble than a Listener that Listens at a More Reasonable Level
– so Making a Compromise, Most Mixers Shoot for a Happy Medium with a Level somewhere between 75dB and 85dB SPL (for Dolby Dedicated Works a SPL of 85dB is Recommended)
- it is Proven that at 85dB SPL we are Able to Hear Very Linear (i.e. Biggest Peaks Hitting 85dB SPL, Using Slow and C-Weighted Method), i.e. you Hear Bass vs Mid Range vs Treble Very Equal Proportioned
– but when you Lower the Volume from the 85dB SPL Down, you Dip the Bass and High Frequencies with Only the Mid Range Lasting Equal Proportioned (i.e. you Hear Bass and High Frequencies No More Linear)
- Another Simple Home Studio Example, you Mix at Home at Around 50dB, in Order to Hear the Bass “Linear” you Increase it Around 30dB, but when you Take that Mix into a Club Where it is Played at 80dB or 90dB, the Bass has Still that 30dB Plus and Hits at 110dB to 120dB which is Totally out of Relation
Leave a Reply